Dashboards in Lightfield
Last updated: August 10, 2026
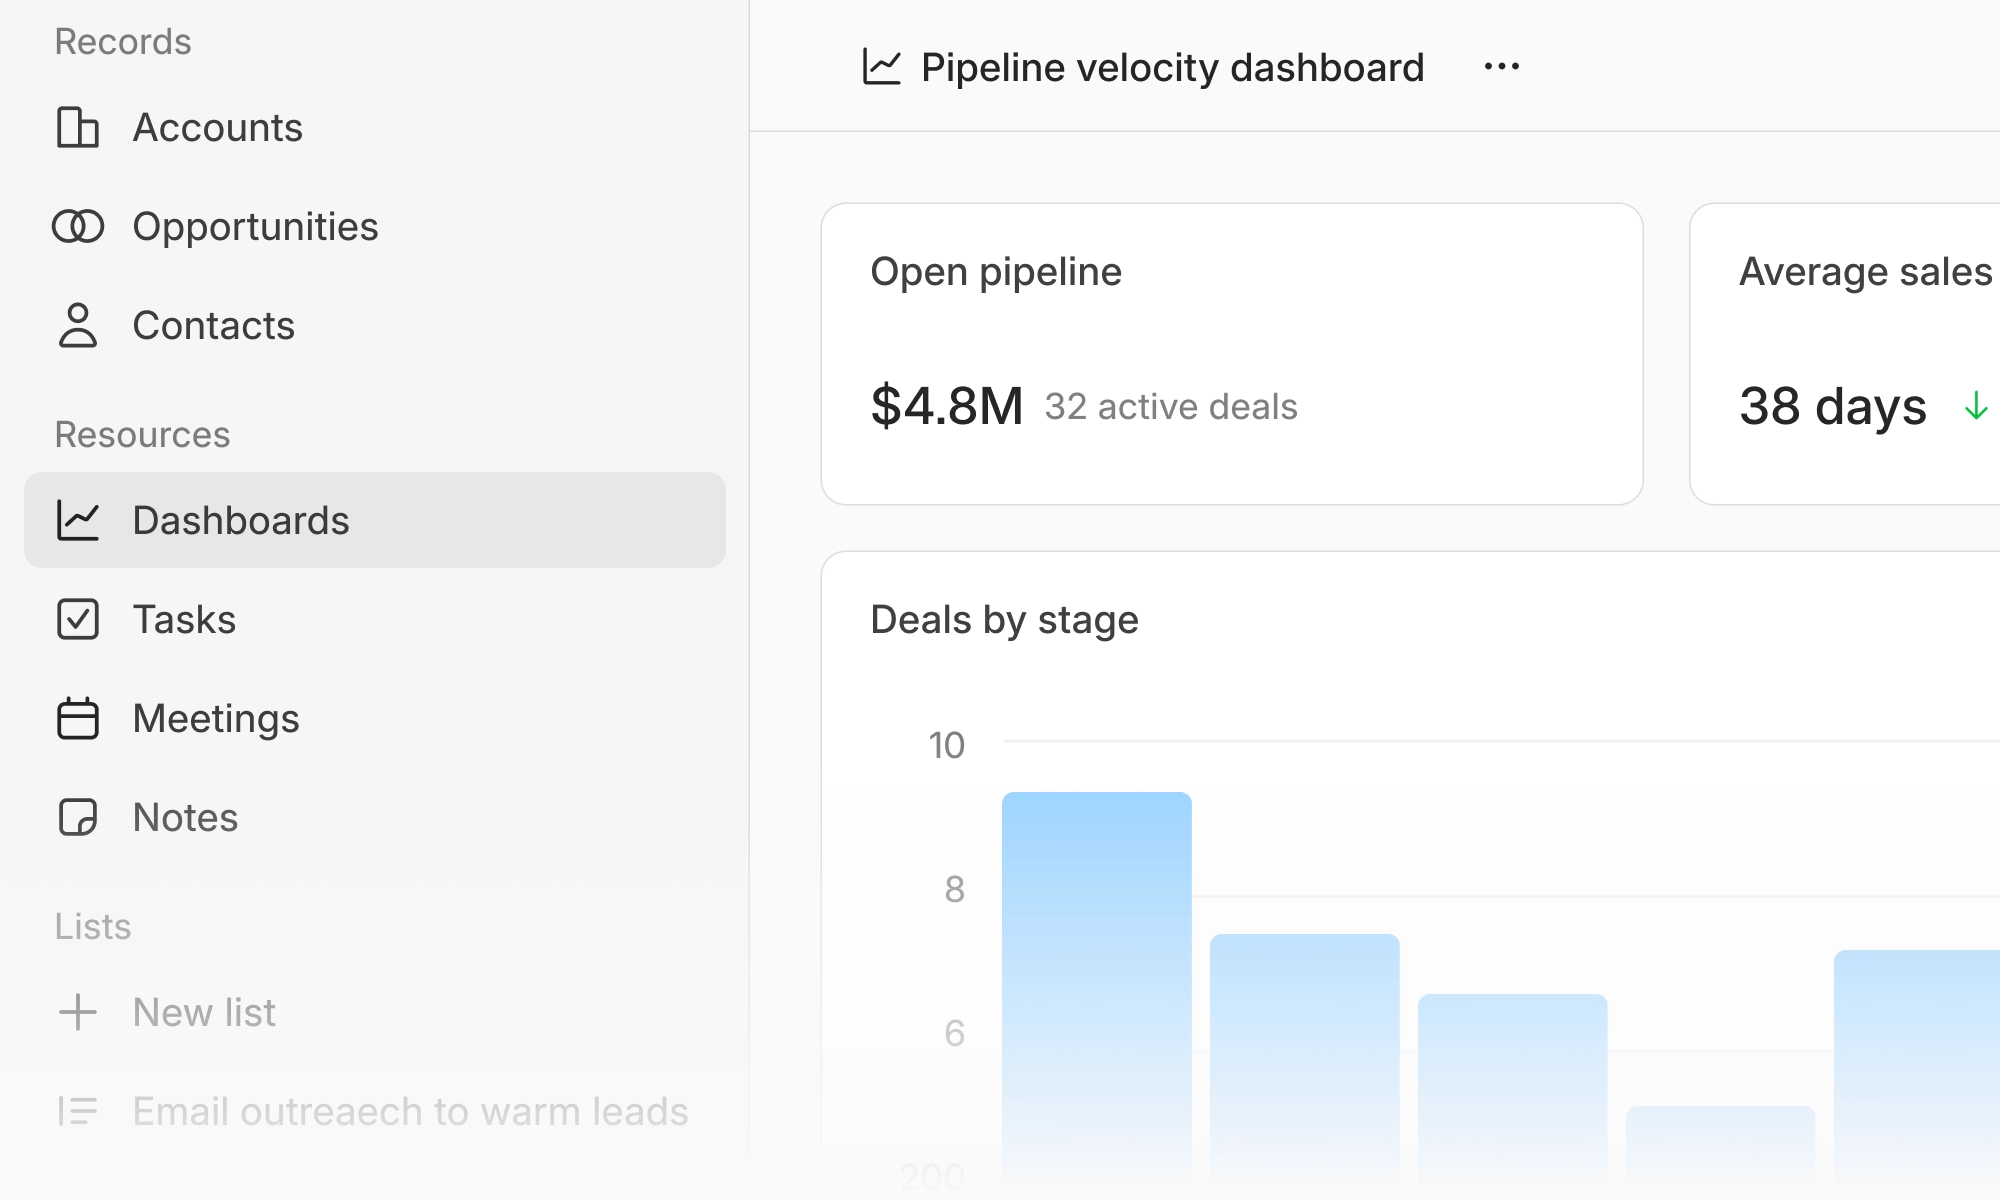
Dashboards turn your Lightfield CRM data into saved, visual reports. Use them to monitor important metrics, explore the underlying data, and ask the Lightfield agent follow-up questions.
Who can access Dashboards?
Dashboards are available on the Pro plan.
Only workspace admins can create dashboards. New dashboards are private by default. Once an admin makes a dashboard visible to the workspace, anyone in the workspace can view it — viewing is not limited to admins.
Dashboard visibility | Who can view it? |
|---|---|
Private | The dashboard's creator and workspace admins |
Workspace | Everyone in the workspace |
Workspace admins can view every dashboard in the workspace, including private dashboards created by other admins.
Copying a dashboard link does not grant access. The recipient must already belong to the workspace, and the dashboard must be visible to them — workspace-visible for members, or any dashboard for admins.
Workspace admins
Admins can:
View all private and workspace-visible dashboards
Create dashboards through chat
Ask the agent questions about a dashboard and its data
Use chat to add, edit, or remove reports
Drag and resize reports on the full dashboard page
Make a dashboard private or visible to the workspace
Move dashboards to trash
Workspace members
Members with access can:
View dashboards that have been made visible to the workspace
Ask the agent questions about a dashboard
Open reports and select chart values to inspect the records behind them
Adjust supported date filters for their current view
Members can use chat to explore and understand a dashboard, but only admins can use chat to modify it.
Before you share a dashboard with your workspace
Dashboard reports and their drill-down records are scoped to your workspace, but they are not filtered by each viewer’s individual record permissions. Everyone who can see a dashboard sees the same values, charts, and underlying records that the admin who built it sees.
This means a workspace-visible dashboard can show a member data they could not open directly in the CRM. It matters most for reports built on email, meetings, or meeting transcripts: the CRM normally limits those records to their participants, but a dashboard report does not. Members can open reports and select chart values to inspect the specific records behind them.
Because only admins can create dashboards and control their visibility, this is an admin decision. Before making a dashboard visible to the workspace:
Open each report, select representative chart values, and review the records behind them—not just the headline number.
Pay particular attention to reports drawing on email, meetings, transcripts, or notes.
Remember that table reports return every matching row, not a preview. A table built on email or transcripts can be read in full by anyone who can see the dashboard.
Keep the dashboard private and share the findings another way if any report would expose data a member should not see.
Changing visibility takes effect immediately, and members are not notified. You can set a dashboard back to private at any time, which removes member access going forward.
Supported reports
New dashboards can include:
Metrics: A single KPI, such as total pipeline or average deal size
Bar charts: Vertical, horizontal, grouped, or stacked comparisons
Line charts: Single- or multi-series trends over time
Pie charts: A breakdown of a total by category
Radar charts: A comparison of values across multiple dimensions
Tables: Detailed data organized into rows and columns
Markdown: Static text for context, explanations, notes, or instructions
Area charts are coming soon.
Values can be formatted as numbers, percentages, durations, or supported currencies.
Dashboards can report on supported Lightfield data, including accounts, opportunities, contacts, tasks, notes, meetings, mail, lists, users, custom objects and fields, relationships, transcripts, and conversations. Because Lightfield keeps a history of field changes, reports can also answer point-in-time questions, such as how a metric has moved over time.
Each report queries your current workspace data when it loads rather than displaying a permanently frozen snapshot.
Create a dashboard
Open Dashboards from the sidebar and click Create in chat button. Or you can ask the agent to create a dashboard from any chat. Describe the questions you want the dashboard to answer.
For example:
"How much pipeline is open right now, what's our average deal size, and how do opportunities break down by stage?"
"Which deals are closing this month, and which accounts have we met with most this quarter?"
"I run a weekly pipeline review. How is each owner tracking, and what moved stage since last week?"
Lightfield creates the dashboard as private. When it is ready to share, an admin can make it visible to the workspace.
Explore a dashboard with chat
Anyone who can view a dashboard can chat with the Lightfield agent about it. The dashboard is included as context, helping the agent understand which reports and data you are referring to.
For example, you can ask:
"What are the most important takeaways from this dashboard?"
"Why did this metric change?"
"Which opportunities are contributing most to this number?"
"Are there any unusual trends or outliers?"
"Compare this month with the previous month."
"What should I investigate next?"
Opening an individual report gives the agent more specific context, so you can ask detailed questions about that report.
For members, these conversations help investigate and interpret the data without changing the dashboard.
Inspect an individual tile
Select a tile to open its detailed view. You can:
Ask the agent questions about that specific report in the tile
View the natural-language question the report answers
See the data values plotted in the chart
Select a chart value to drill down into the records behind it
Change its date or date range
Adjust the interval shown by supported line charts
Drill-down is available across supported chart types. Select a bar or segment, line-chart point, pie slice, or radar value to see the records contributing to that value.
Metric reports show the records behind the metric when you open them. Table reports already display their underlying rows, while Markdown reports do not have underlying data.
If drill-down has not been configured for an older report, an admin can ask the agent to add it.
Modify a dashboard with chat
Admins can use chat to change a dashboard. Open the dashboard and describe the update you want.
For example:
"Add a report showing pipeline by owner."
"Change this report to a pie chart."
"Update this metric to include only open opportunities."
"Rename this report to 'Pipeline at risk.'"
"Remove the meetings report."
"Make the top opportunities table wider."
“Change this report to a line chart showing pipeline by week.”
Changes appear on the dashboard as the agent works.
What isn't supported yet?
Dashboards currently do not support:
Dashboard creation or editing by non-admin members
A point-and-click report builder or manual SQL editor
Dashboard-wide filters or cross-filtering between reports
Per-viewer permission filtering of report data — reports are scoped to the workspace, not to each viewer's record access
Saving a viewer's temporary date-filter changes
Opening drill-down results as a separate filtered CRM record list or saved view
Public links, guest sharing, or embedded dashboards
Direct connections to arbitrary external databases or BI sources
Reporting on unsupported product data such as automation or workflow runs, documents, and attachments
Best practices
Build around a question, not a metric. Dashboards are created by describing what you want to know, so "which deals are slipping this quarter?" produces a better result than "add a pipeline chart." The agent saves the question behind each report, and anyone viewing it can read that question to understand what they're looking at.
Give each dashboard one job. Reports can't be filtered together, and there are no dashboard-wide filters, so a dashboard covering several topics can't be narrowed down to one of them. A focused dashboard per audience or ritual — a weekly pipeline review, a single team's activity — stays useful longer than one that tries to cover everything.
Prefer metrics and charts over tables for anything widely shared. A table report returns every matching row, so it exposes far more than a summary of the same data. Reach for a table when the individual rows are the point, not as a default.
Use chat to create or change reports. There’s no report editor. Adding a report, changing what it measures, renaming it, switching its chart type, and removing it all happen by describing the change to the agent. Viewers can directly open reports, adjust supported date filters, and select chart values to inspect the records behind them. Admins can drag and resize reports directly on the dashboard page, or ask the agent. Renaming the dashboard itself is also a direct edit.
Ask follow-up questions instead of stopping at the number. A dashboard is a starting point, not the whole answer. Open a report and ask the agent why a figure moved, which records are driving it, or what to investigate next. It has the report's definition and the surrounding CRM context, so the conversation can go further than the chart does.
Start private, review, then share. New dashboards are private, which gives you room to check each report before anyone else sees it. See Before you share a dashboard with your workspace
for what to look for.